This web page was produced as an assignment for Genetics 677 an undergraduate course at UW-Madison
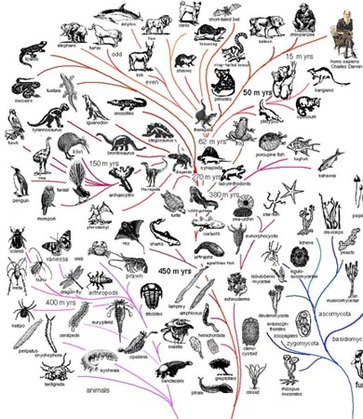
Fig 1: This is an example of a hypothesized phylogenetic tree of all organisms. This proposed tree traces the evolutionary history of different organisms.
|
What is Phylogeny?Phylogeny is the evolutionary relationship between different organisms [1]. One can see this relationship through a phylogenetic tree. Using homologs of gene products, one can trace the evolution of a protein through different organisms and create a phylogenetic tree, a visual representation of the evolutionary path the protein took through different organisms. Creating these phylogenetic trees is important because it can provide valuable information about the protein or gene.
|
Phylogenetic Trees
|
A phylogenetic tree has many different parts. The tips of the branches represent the taxa of study [2]. In the trees for BBS1, they will be the homologous organisms selected. Nodes represent taxonomic units or the separation between taxa [1]. Branches represent the hypothetical ancestor of the taxa [2] The branch length represents the distance of evolution between two nodes. The root represents the original ancestor that the protein originated from. From this ancestor, it evolved in these different organisms. Finally, a clade is a grouping of an ancestor and all of its descendants [2]. Overall, a phylogenetic tree is simply a visual representation of calculations of the evolutionary history of a protein or gene through different organisms.
|
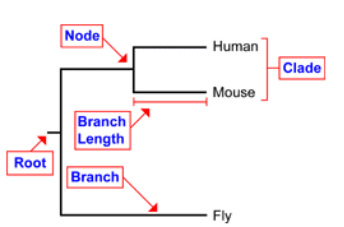
Fig 2: This picture shows how and where the phylogenetic terms are applied.
|
Phylogenetics of BBS1
Using homologous protein sequences to human BBS1, two different phylogenetic trees were calculated on ClustalOmega. ClustalOmega is a multiple-sequence alignment program that aligns the protein sequences of the homologs, finding similarities between the sequences. From this alignment, two trees was calculated using two different methods: neighbor joining and average distance . Neighbor joining is when a tree is calculated the minimum distance of all the branches is obtained [3]. Then, it calculates the tree that provides the minimum evolution needed for the protein given the sequences provided [3]. This is done by first creating a tree with only branches (no nodes) which is based upon a distance matrix [4]. Then, separate nodes are calculated based upon the divergence of it from other nodes in the tree [4]. Nodes that are closest to each other are connected until the tree is complete. Average distance operates in a slightly different and simpler manner. Average distance simply creates a tree based upon sequence differences between homologs [3]. A third tree was constructed using a T-Coffee method at this website.
These three methods of trees are given below.
These three methods of trees are given below.
Phylogenetic Trees
|
The alignment data from ClustalOmega
|
|
||
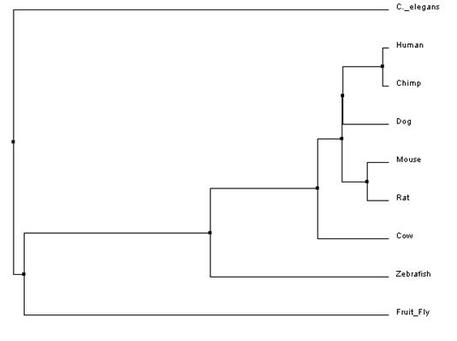
Fig 3: This phylogenetic tree was created using a average distance clustering method.
|
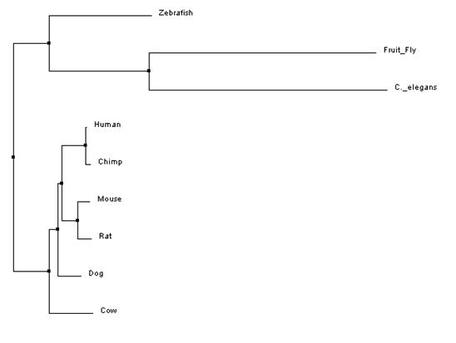
Fig 4: This phylogenetic tree was created using a neighbor joining clustering method.
|
|
The alignment data for T-Coffee
|
|
||
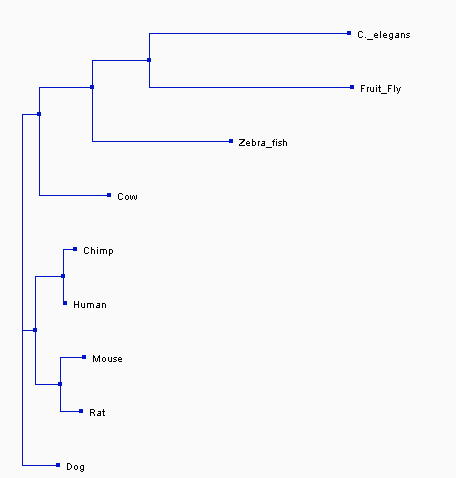
Fig 5: This phylogenetic tree was created using a T-Coffee calculation method.
Analysis and Discussion
The trees that were made are based upon the three different methods discussed above- neighbor joining, average distance, and T-Coffee. These trees show three different evolutionary paths of the protein BBS1. In all the trees, one can see that BBS1 in humans is closely related to the homolog in Chimps. They also both show that dog, mouse, and rat homologs are closely related to human BBS1 but not as close as Chimp. This relatedness makes sense when one considers the fact that all four organisms are mammals. Both trees further show that C. elegan, fruit fly, and zebra fish are not as closely related to human BBS1 as the other organisms and diverge greatly from the protein, as seen by the early divergence in nodes in both trees. This indicates that the proteins between these organisms and humans are not closely related. Overall, although all trees are slightly different in shape and are calculated differently but show similar relatedness between the proteins of the different organisms.
References:
[Banner Photo] "NDM-1" NDM-1. Retrieved 12 March 2013 from http://www.personal.psu.edu/czc5161/blogs/testing/references.html.
[1] Brinkmann H, Delsuc Frederic, Philippe H. Phylogenomics and the Reconstruction of the Tree of Life. Nature Review, 2005;6:361-375
[2] "Tree Facts: Terminology." Phylogenetic Resources. NCBI, 28 March 2003. Web. 28 Feburary 2013. <http://www.ncbi.nlm.nih.gov/Class/NAWBIS/Modules/Phylogenetics/phylo7.html>
[3] "29+ Evidences for MacroevolutionPhylogenetics Primer." The TalkOrigins Archive: Exploring the Creation/Evolution Controversy. 1999. Web. 28 February 2013. <http://www.talkorigins.org/faqs/comdesc/phylo.html#trees>
[4] "The Neighbor Joining Method." 1999. Web. 28 February 2013. <http://www.icp.ucl.ac.be/~opperd/private/neighbor.html>
